The Profit and loss report makes it easy to review your business performance. You can see what's contributing the most to your bottom line, and the areas of your business that could be performing better.
You can also compare this year's results to the previous year, to see if there are any improvements. And if you've set up a budget, you can see if you've achieved what you expected.
Note that the profit and loss report shows GST exclusive values, as the GST is allocated to the GST accounts when transactions are recorded.
To view the profit and loss report
Go to the Reporting menu and choose Reports.
Click to open the Profit and Loss report.
Using the filters across the top, filter the report as required.
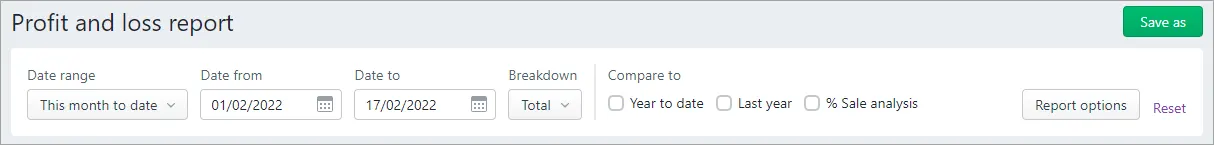
Choose the Date range for the period you want to review.
From the Breakdown field, choose whether you want to view the results for each month, quarter (if the report spans more than 3 months) or year (if the period spans more than 12 months), or the total results for the period you selected.
Choose a Compare to option (Year to date, Last year or % Sale analysis).
to compare this year's results to last year select the Last Year option. The report will show the variance with last year, in both dollar and percentage terms.
to compare your results to a budget that's for the period you're reviewing, click Report options then select the Budget option and then select the budget you want to compare from the drop-down list. The report will show the variance in both dollar and percentage terms.
to see a detailed view of your accounts click on the account total, you'll see a list of transactions for that account.
to display the report as a bar or line graph by clicking the bar graph or line graph buttons. See the section below for more information about the graphs.
to access your P&L preferences by clicking Report options you can choose your accounting method, how you want to display your figures and negative values, and what you want to display or hide in your report.
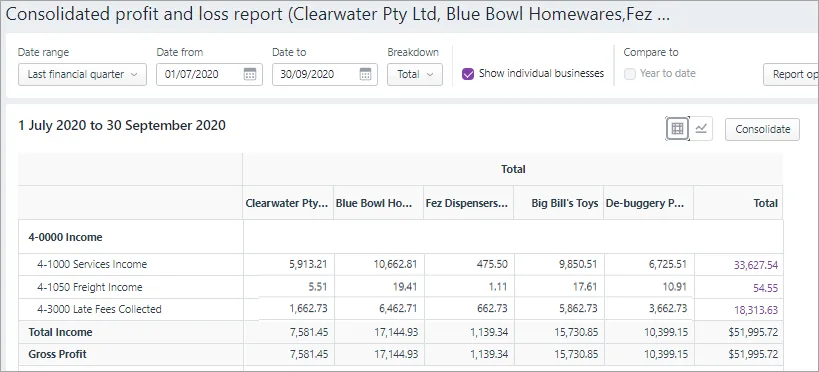
If you've got multiple MYOB businesses, you can combine them into one report by clicking Consolidate and selecting the businesses you want to compare:
If you want to save the report with your settings, click Save as and choose a name for the report. The report is then available in the Custom reports tab.


To view profit and loss graphs
Sometimes it's easier to review the profit and loss report when viewed as a graph. You can choose to display the report as a bar graph or a line graph.
Follow the steps in the procedure above to display the profit & loss report.
Choose the graph you want to display (depending on what you've selected in the Breakdown menu, the graph will display different levels of detail).
Bar graph: Use this option when you want to compare figures for each month, quarter, year or the total.
Line graph: Use this option when you want to see how a category has changed over time.
Hover over the bars, or line points to see the dollar value.
Exporting, saving and printing
You can export your report as an Excel spreadsheet or PDF by clicking Export. Note that you must enable editing of the spreadsheet from within Excel. If editing is disabled, the spreadsheet will not display the totals calculated in the report.
When exporting PDFs, you can also choose which style template you want to use. When the PDF displays, you can save it.
When viewing a report, click View and print to display the report as a PDF in a new browser tab, where you can save or print it.