
- Created by StevenR, last modified by AdrianC on Oct 17, 2016
You are viewing an old version of this page. View the current version.
Compare with Current View Page History
« Previous Version 32 Next »
https://help.myob.com/wiki/x/QQTW
How satisfied are you with our online help?*
Just these help pages, not phone support or the product itself
Why did you give this rating?
Anything else you want to tell us about the help?
The Profit & Loss report makes it easy to review your business performance. You can see what's contributing the most to your bottom line, and the areas of your business that could be performing better.
You can also compare this year's results to the previous year, to see if there are any improvements. And if you've set up a budget, you can see if you've achieved what you expected.
View the profit & loss report
- Go to the Reports menu and click Profit & Loss.
- In the From and To fields, enter the period you want to review.

- From the Breakdown field, select whether you want to view the results for each month, quarter (if the report spans more than 3 months) or year (if the period spans more than 12 months), or the total results for the period you selected.
In the example, below the Quarterly option has been selected. As the report covers two quarters, these are shown separately, and the Total column shows the combined values for the two quarters.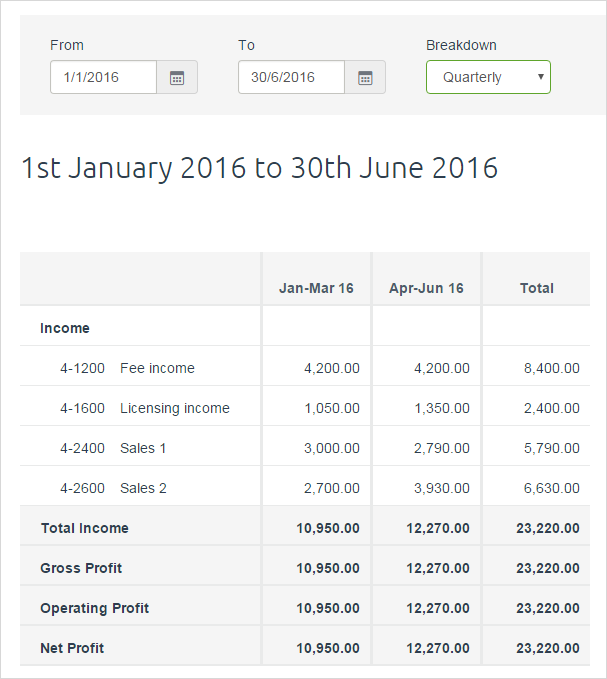
- You can customise the report to show more information.
You can:- compare this year's results to last year by clicking the Last Year checkbox. The report will show the variance with last year, in both dollar and percentage terms.
- compare your results to a budget that's for the period you're reviewing, click the Budget checkbox and then select the budget you want to compare from the drop-down list. The report will show the variance in both dollar and percentage terms.
- see a detailed view of your accounts by clicking on the account Total. From the Detail view that appears, you'll see a list of transactions for that account.

- display the report as a bar or line graph by clicking the bar graph or line graph buttons. See the section below for more information about the graphs.
- Click the cog in the upper-right corner of your screen to access your P&L preferences, where you can choose your accounting method, how you want to display your figures and negative values, and what you want to display or hide in your report.

View profit & loss graphs
Sometimes it's easier to review the profit & loss report when viewed as a graph. You can choose to display the report as a bar graph or a line graph.
- Follow the steps in the procedure above to display the profit & loss report.
- Choose the graph you want to display (depending on what you've selected in the Breakdown menu, the graph will display different levels of detail).
- Bar graph: Use this option when you want to compare figures for each month, quarter, year or the total.


- Line graph: Use this option when you want to see how a category has changed over time.


- Bar graph: Use this option when you want to compare figures for each month, quarter, year or the total.
- By default, the graph will display the Total Income results. You can change this to a different category, or click the + Add item button to add up to two more categories to compare side by side, such as Total Expenses and Net Profit.

- Hover over the bars, or line points to see the dollar value.

- if you want to see the cumulative effect of your results over time, click the Cumulative option. (Note that depending on the Breakdown you selected and the period range this might not have any effect on the chart).
In the example below, you can see how selecting the cumulative option changes the information that's presented. The first graph shows each month's results, and for June 2016 no income was generated. The cumulative graph, shows that by June 2016 the income generated for the reported period was $23,000.
Export your profit & loss report
Exporting your profit & loss report is the quickest, easiest way to share your report outside of MYOB Essentials.
From the profit & loss report, click Export.

The Export dropdown menu appears.
Click Excel to download an Excel file.

Click PDF to download a PDF file.

When they finish downloading, the exported files can be found in your Downloads folder. What you do with them next is up to you!
 Yes
Yes
 No
No
 Thanks for your feedback.